SEAL
Name of the project: SEAL: A tool for exploring the impact of observation scale on species richness
Collaborator: Martin Matouš (independent researcher, Czech Republic)
Advisors: Jeff Nekola (Masaryk University, Czech Republic)
Funding: Masaryk University
The software beta version was presented on Zoological Days 2024.
All materials on this page are shared under a CC BY-NC-ND 4.0 license. Find more information at https://creativecommons.org/licenses/by-nc-nd/4.0/.
Species richness is influenced by components of the observation scale, namely extent and grain. This effect varies among organisms, for example, according to their mobility or the presence of environmental gradients at the site. The tool allows the manipulation of scale components and observation of their impact on various characteristics of the target community. You can find out more about scale, grain, and extent in this post.
Would you like to know if your observations are also influenced by grain and the extent of observation? You are lucky, we have a handy tool for you. SEAL: a tool for exploring the impact of observation scale on species richness.
Download it HERE or find more information and files HERE.
Basic information
- SEAL is written in Python (requires Python 3.12+), built on the Pandas, Seaborn, and Plotly libraries.
- Open-source license (GPLv3).
- Usage via CLI or Jupyter notebook.
- Includes documentation and sample data.
Features data validation and cleaning. - High test coverage.
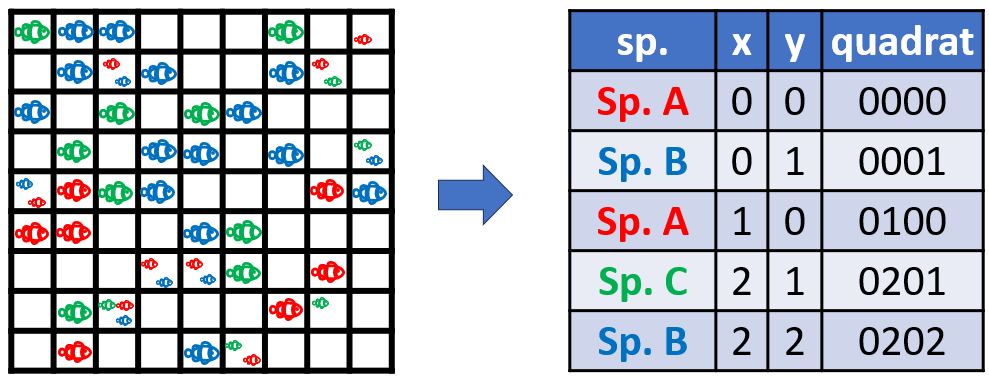
Data format
- Records (rows) contain the observed species, its location, and any additional information (columns).
- Location must be specified using a grid network such as custom grids, faunistic grid or GPS coordinates.
Principles of analysis of grain and extent
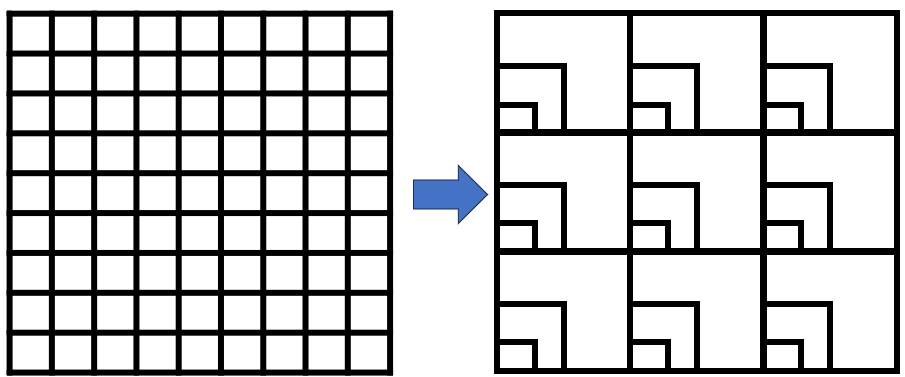
- To study the impact of extent and grain, it is necessary to simulate the existence of differently sized (manipulating grain) and variously spaced (manipulating extent) quadrats in the data.
- SEAL offers several methods for such simulation by creating so-called levels, which are nested quadrats or transects of different sizes.
- Simulated quadrats at smaller levels have larger gaps between them than those at higher levels.
- Analyses are performed for quadrats at all requested levels.
Performed analyses
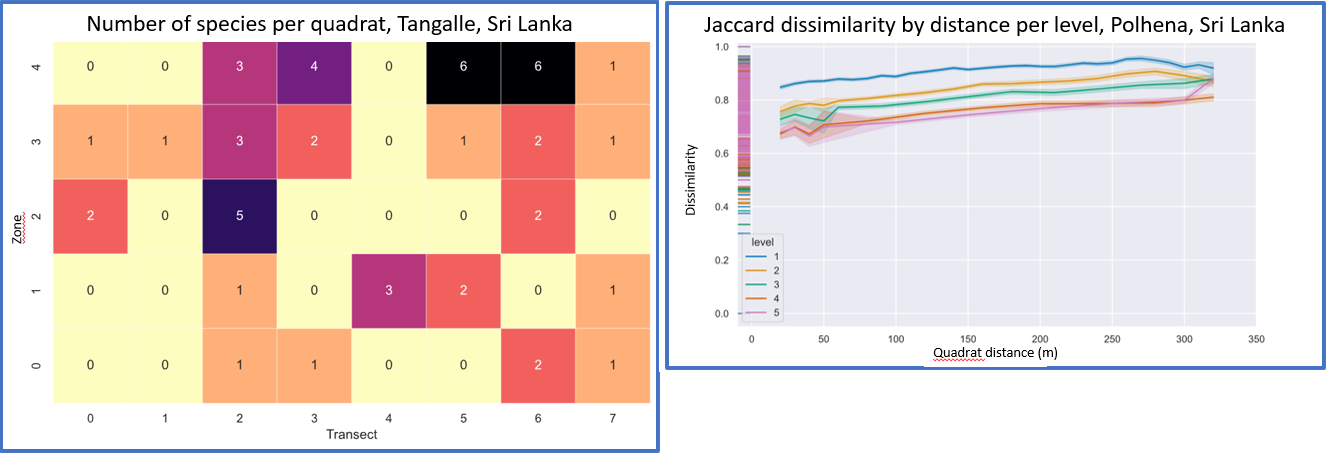
- Data overview, species in quadrats
- Number of species per sampled area (species-area relationship) and its percental change from the sampling of the whole area
- Difference in species composition/distance between quadrats
- Number of species in quadrats at a certain distance from a centroid
- Ratio of the observed to the expected number of species per distance
- Ratio of shared to unique species in quadrats per distance
- Jaccard dissimilarity of quadrats per distance
Graphic outputs
- Automatic creation of graphs with the ability to customize them using the Seaborn or Matplotlib API