Guide to basic Statistical Methods
Statistics doesn't need to be hard. While many natural science students view it as their nemesis, it exists to reveal patterns we might not otherwise see, providing a better understanding of our world. When I help junior students with data analysis, I always look forward to one moment: the smile on their faces when they create their first graph and conduct their first test. Suddenly, incomprehensible data transforms into an easy-to-grasp plot, accompanied by a number validating their findings.
All materials on this page are shared under a CC BY-NC-ND 4.0 license. Find more information at https://creativecommons.org/licenses/by-nc-nd/4.0/.
Unfortunately, teaching statistics is challenging. I applaud any lecturer who can make it understandable and enjoyable, showing students that statistics is not a nemesis but an ally. The biggest hurdle is that students often struggle to remember which test to use for different hypotheses and data types.
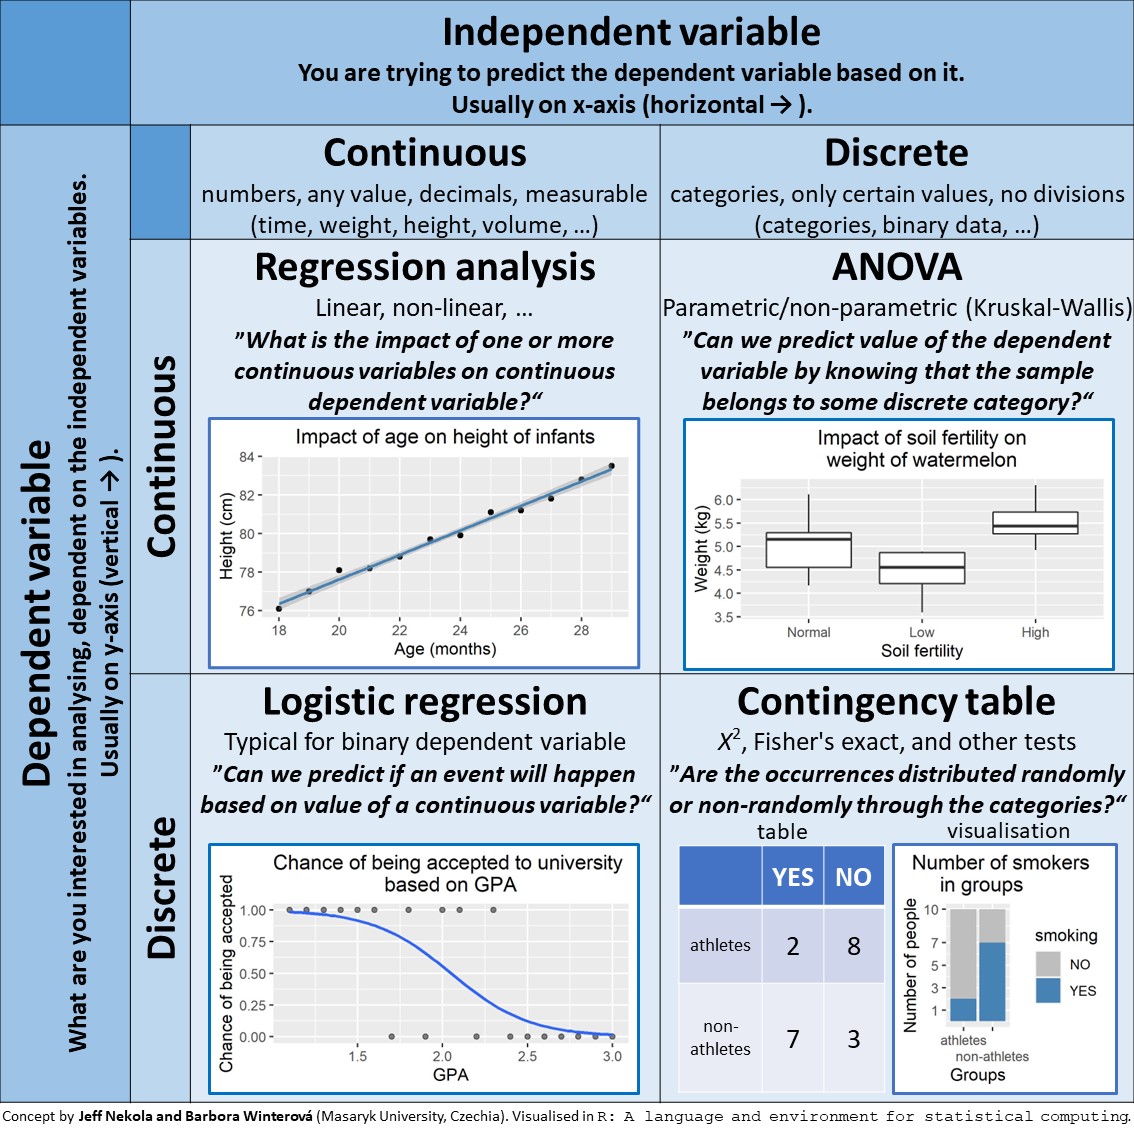
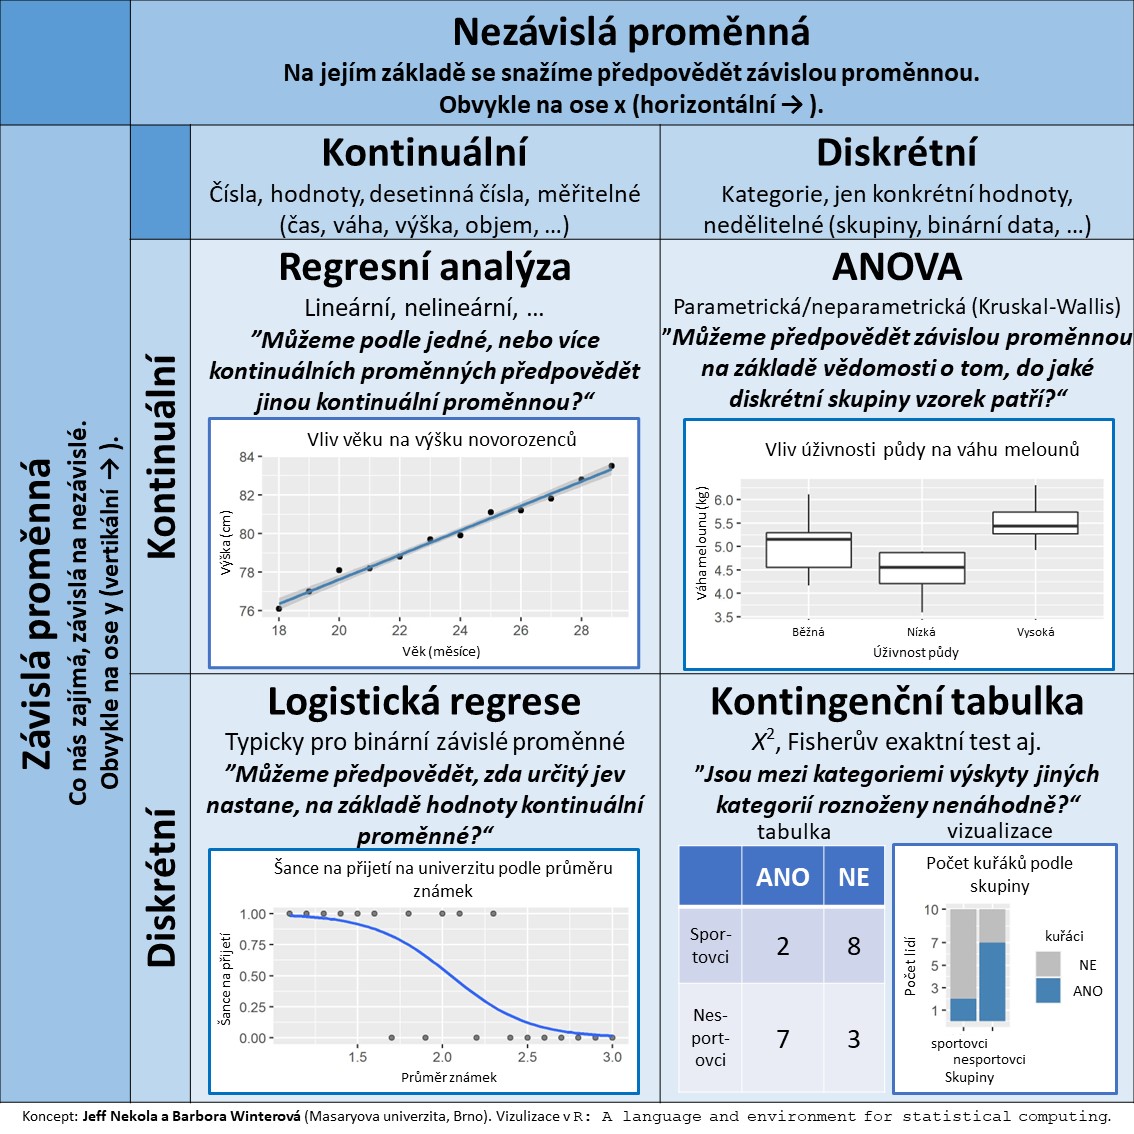
To help, my supervisor and I created a small table outlining the most common basic analyses, logically arranged by data type. It also includes explanations of the most common terms.
It is by no means comprehensive. For example, it doesn't cover the assumptions for different types of tests. However, I believe it can be a useful tool for basic orientation in statistical methods.